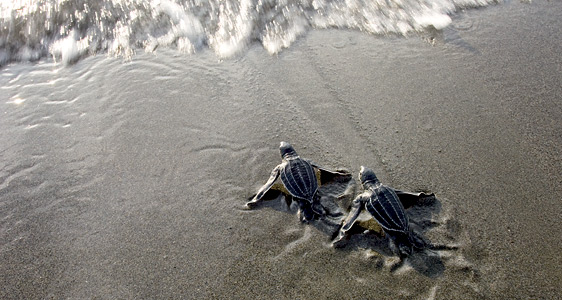
For the past three months I have been doing everything in my power to get a hold of leatherback sea turtle size measurements. Some might think that this is a trivial task, (why bother?), and others might think that this is easy enough, but if there is one thing I have learned, is that I will never ever take data for granted ever again. Because as it turns out, when it comes to size data, a lot of people are a little like this:
Why do I care about the size of leatherbacks and any geographical and biological size variation patterns? The question you should be asking is, why do you NOT care about geographical and biological size variations in leatherbacks??? Understanding these aspects of the leatherback sea turtle would allow us to further understand this amazing organism and many of its mysteries such as where the juveniles spend their time before becoming adults (nobody really knows this), and how this giant is able to survive such cold waters in comparison to its smaller sea turtle counterparts like the loggerhead and the green, and might even possibly lead to important conservation implications for this critically endangered giant. The real question is though, why would’t you want to be spending hours upon hours a week studying this awesome animal?

Although it took a while to make up a solid database with size measurements, once I finally had it all nicely and neatly assembled, it was time to start messing around with the data. Only problem is, there was a lot of data. And I didn’t know where to start, feeling a little like this looking at all those numbers and codes:

And then there was the problem of trying to make R package work with me instead of very very very against me.

But, after countless hours, I was finally able to get some plots and some actual results! Yay. What did I find you ask? Firstly, I made this really neat histogram of leatherback size distribution: I found a mean curved carapace length of 1.511m, which closely matches other means found in the literature. Looking at the histogram above there is a clear gap in the 0.3m-0.9m range. This actually represents the gap in the knowledge about what happens to leatherbacks in between the few juveniles that are occasionally spotted and the large adults we see. These years are sometimes referred to as the “lost years” because we simply do not know where they go to grow as large and in charge as they grow to be.
But wait! There’s more! I compared the length of the turtles to the ocean basin in which they were measured and then compared that to a bunch of other means I found in the literature, and found that overall, Pacific Ocean leatherbacks appear to be larger than other places, and the smallest turtles we see are either in the Atlantic or in the Caribbean. If that’s not fascinating I don’t know what is. 
 One last thing which was pretty cool that came up in my data was when I was comparing the mass to the lengths of the leatherbacks:
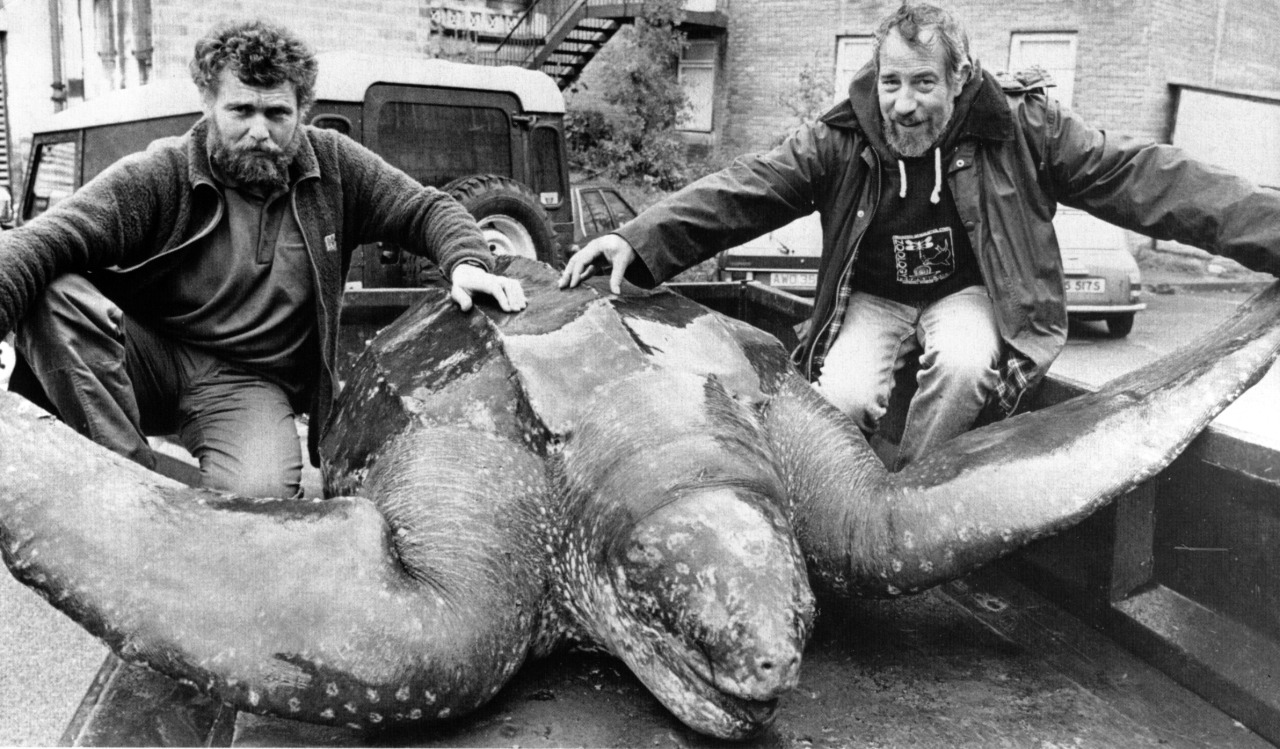
See that clear outlier at 916kg? How is that one turtle so much heavier than all the other ones even though it is at a fairly average curved carapace length? This particular turtle is referred to as the Harlech turtle after where is washed up in 1988. It is now currently on display at National Museum Cardiff, so apparently it was the real deal, and yet its mass far outshines any other turtle found. What let this one turtle get so big? Where did the extra mass come from? Fat or muscle or something else and what does that mean? It’s a little bit of a mystery right now but stay tuned because I’m on the case.

Although I have a long way to go before I have analyzed everything, these are some really interesting initial findings and I am actually really excited to find out what other secrets lie in my data set. I feel like a kid on christmas. Except instead of santa i get scientists. And instead of presents I have numbers. Yay.


